Reimagining how web developers debug issues

The “Unsaid” Problem
All companies having a digital presence have a tech team and the developers are the core part of it. Post Covid, every company has become a software company irrespective of their business model or product. They continue to invest in developer productivity, bringing developers closer to the problem and the customers.
Ask your developer is a great book by Jeff Lawson, CEO of Twilio that talks about how software companies can win by harnessing the power of developers. “Ask your developer” mindset is great to let developers build the right & innovative solution but if you don’t provide enough clarity about the problem, you won’t get the most efficient solution.
In this article, I am going to talk about how we can enable “web” developers to investigate & troubleshoot bugs faster and save precious developer time but before that, we need to understand the problem in a little bit more depth.
A vast majority of issues surface during internal testing by peers, managers, designers, support engineers, and other stakeholders in the company but the process of reporting the issues is too manual which leaves too much gap in passing the context and developers end up spending time in building the context, sometimes even guessing and then proceed to fix the issue.
Here’s a list of some problems web developers face (This is not an exhaustive list, but just to give you an idea)
- The issue is described vaguely (e.g. Feature X is not working)
- Steps to reproduce are wrong/incomplete
- Intermittent Issue
- User-specific Issue
- Not enough details are provided like a Video of the Issue or Network errors are missing
Here’s the workflow of the debugging process
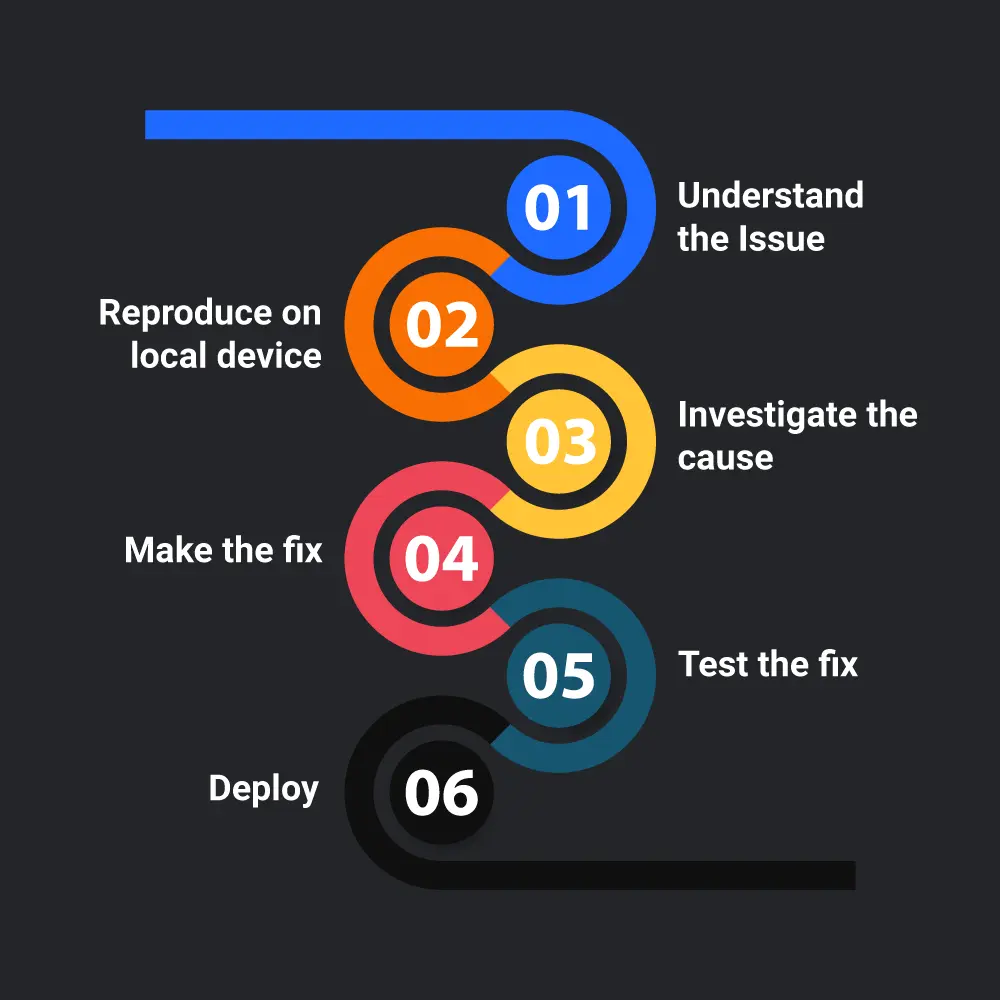
If the complete context is not passed, developers spend time building the context to understand the issue which can require multiple rounds of communication between the issue reporter & the developer.

Info web developers need for debugging
Here is a list of things if available to web developers can speed up their debugging process
- Browser Name & Version
- OS Name & Version
- Console Logs & Errors
- Error StackTrace
- Network Logs
- DOM Information
- LocalStorage State
- Feature Flags
- UserID
The Solution
Having to send all the information mentioned above while reporting an issue can be daunting so we need an automated solution that can capture everything from our browser and enable us to send this information to our development team swiftly.
Introducing Session Replays by Requestly – An Open-Source Chrome extension to easily record browsing sessions & securely share them with the development team.
Requestly helps-
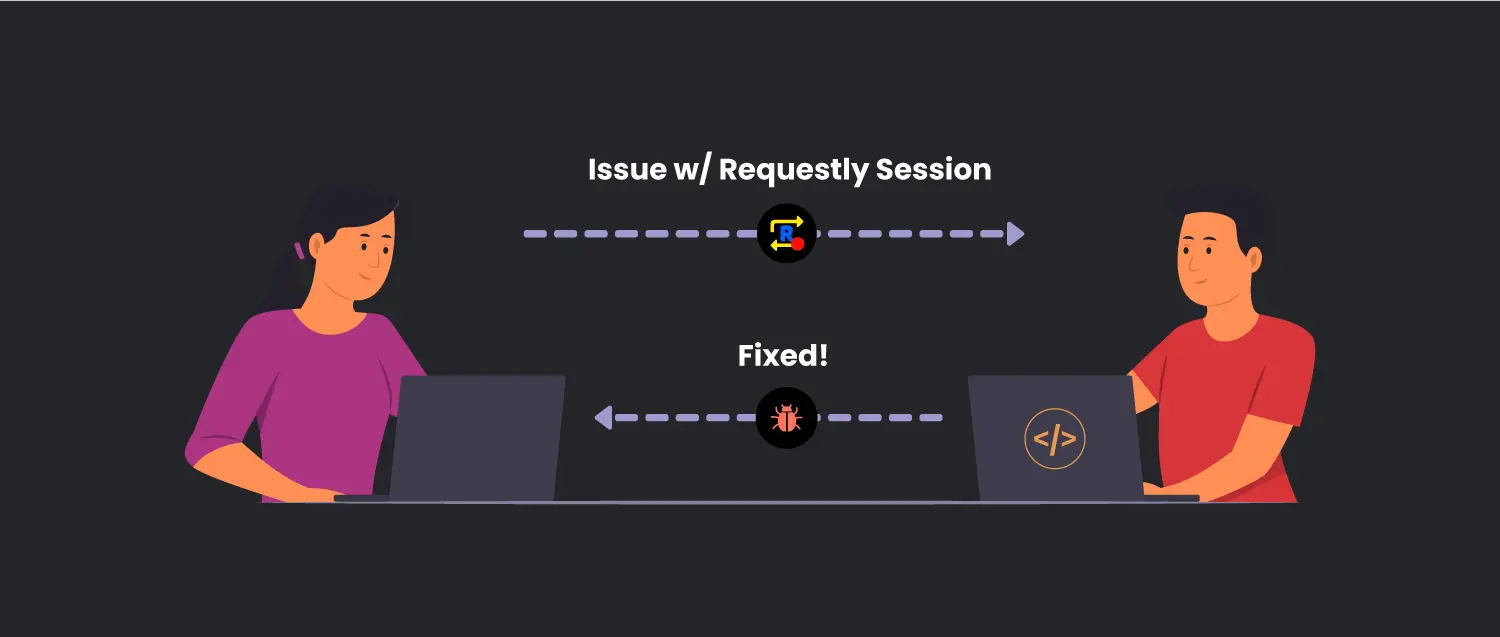
- Issue Reporters with capturing & sharing the sessions
- Developers with playing back the session & configuring HTTP rules to simulate the issue in their browser.
A Sample Session
Here’s an example of a sample session captured on Airbnb.com. You can see all the details being captured like Device Information, Video, Console & Network errors.
How to Record a Session
You can Install Requestly for Chrome, Firefox, Edge, or any other browser from the downloads page.
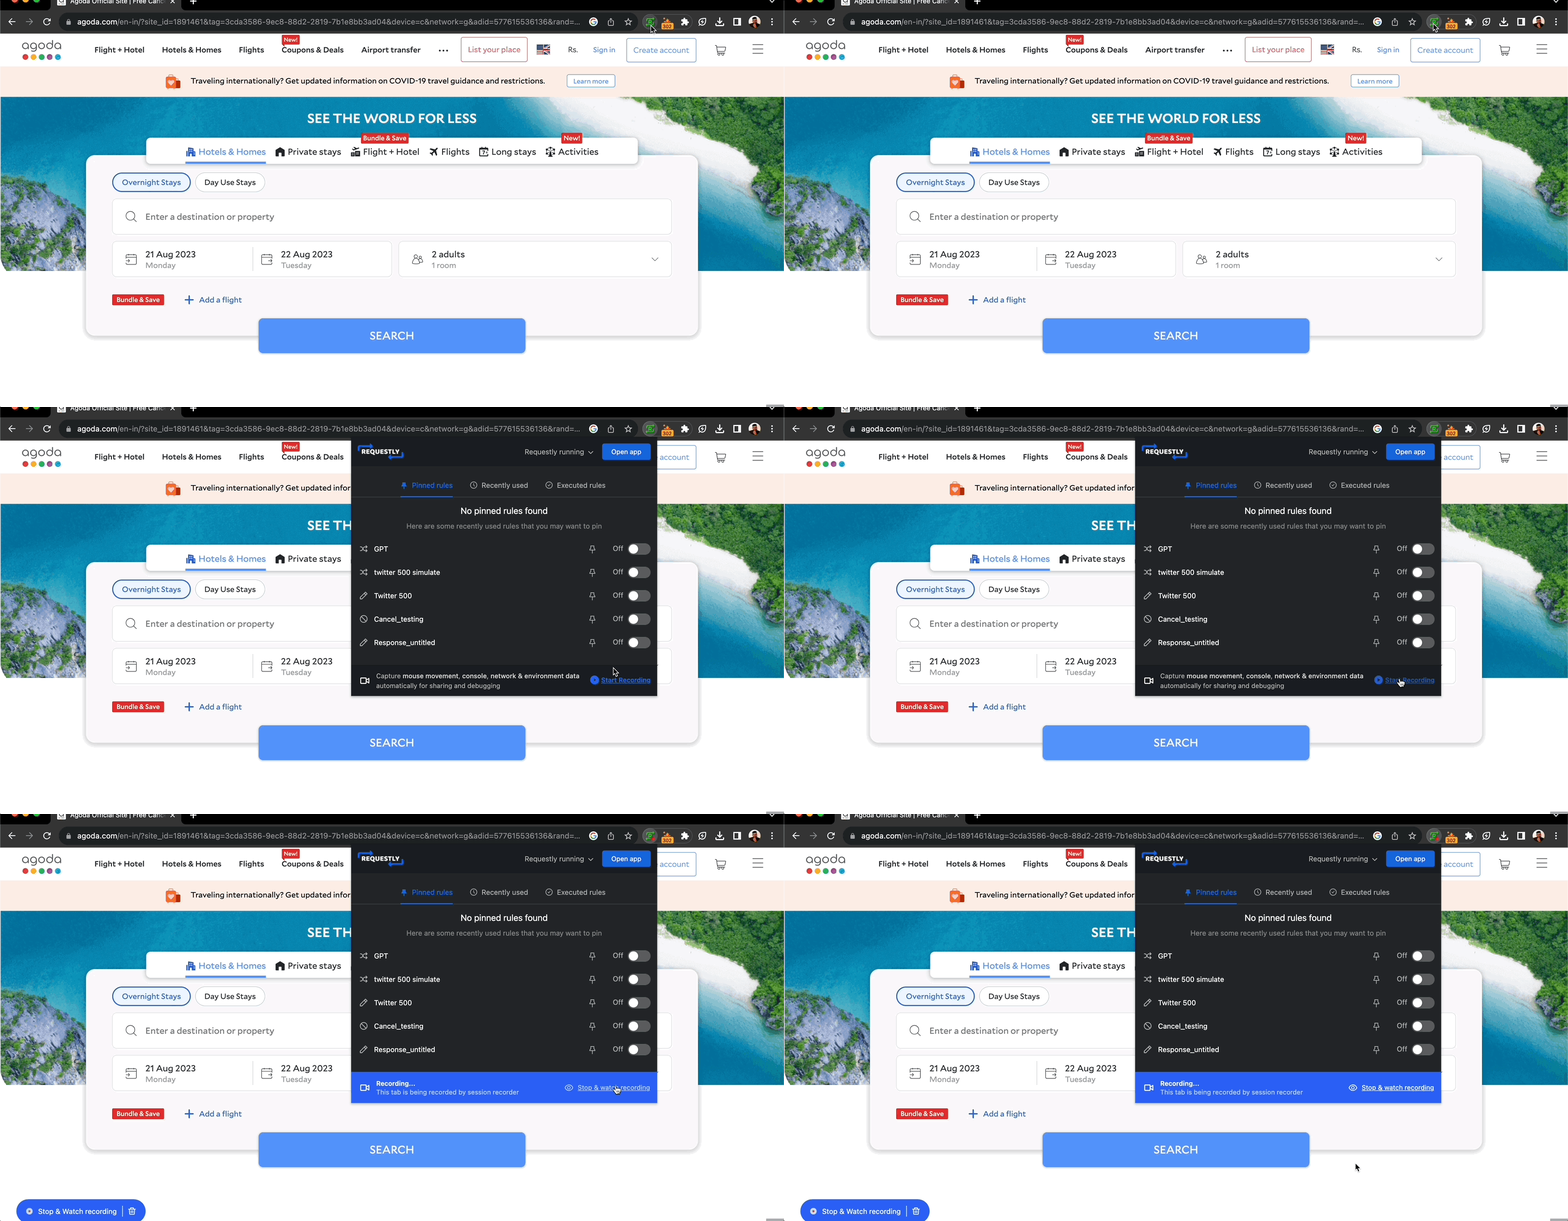
Simply, Click on Start Recording in the extension popup
Sharing a Session
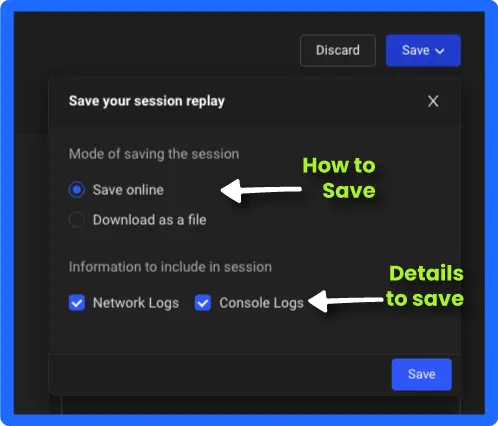
By default, a session is captured directly in the browser and you can choose to either discard it or save/share it with others. While saving the session, you can either save it online or download it as a local file.
You can also choose what information to be saved.
Investigating a Session (Experience a Time Travel debugger)
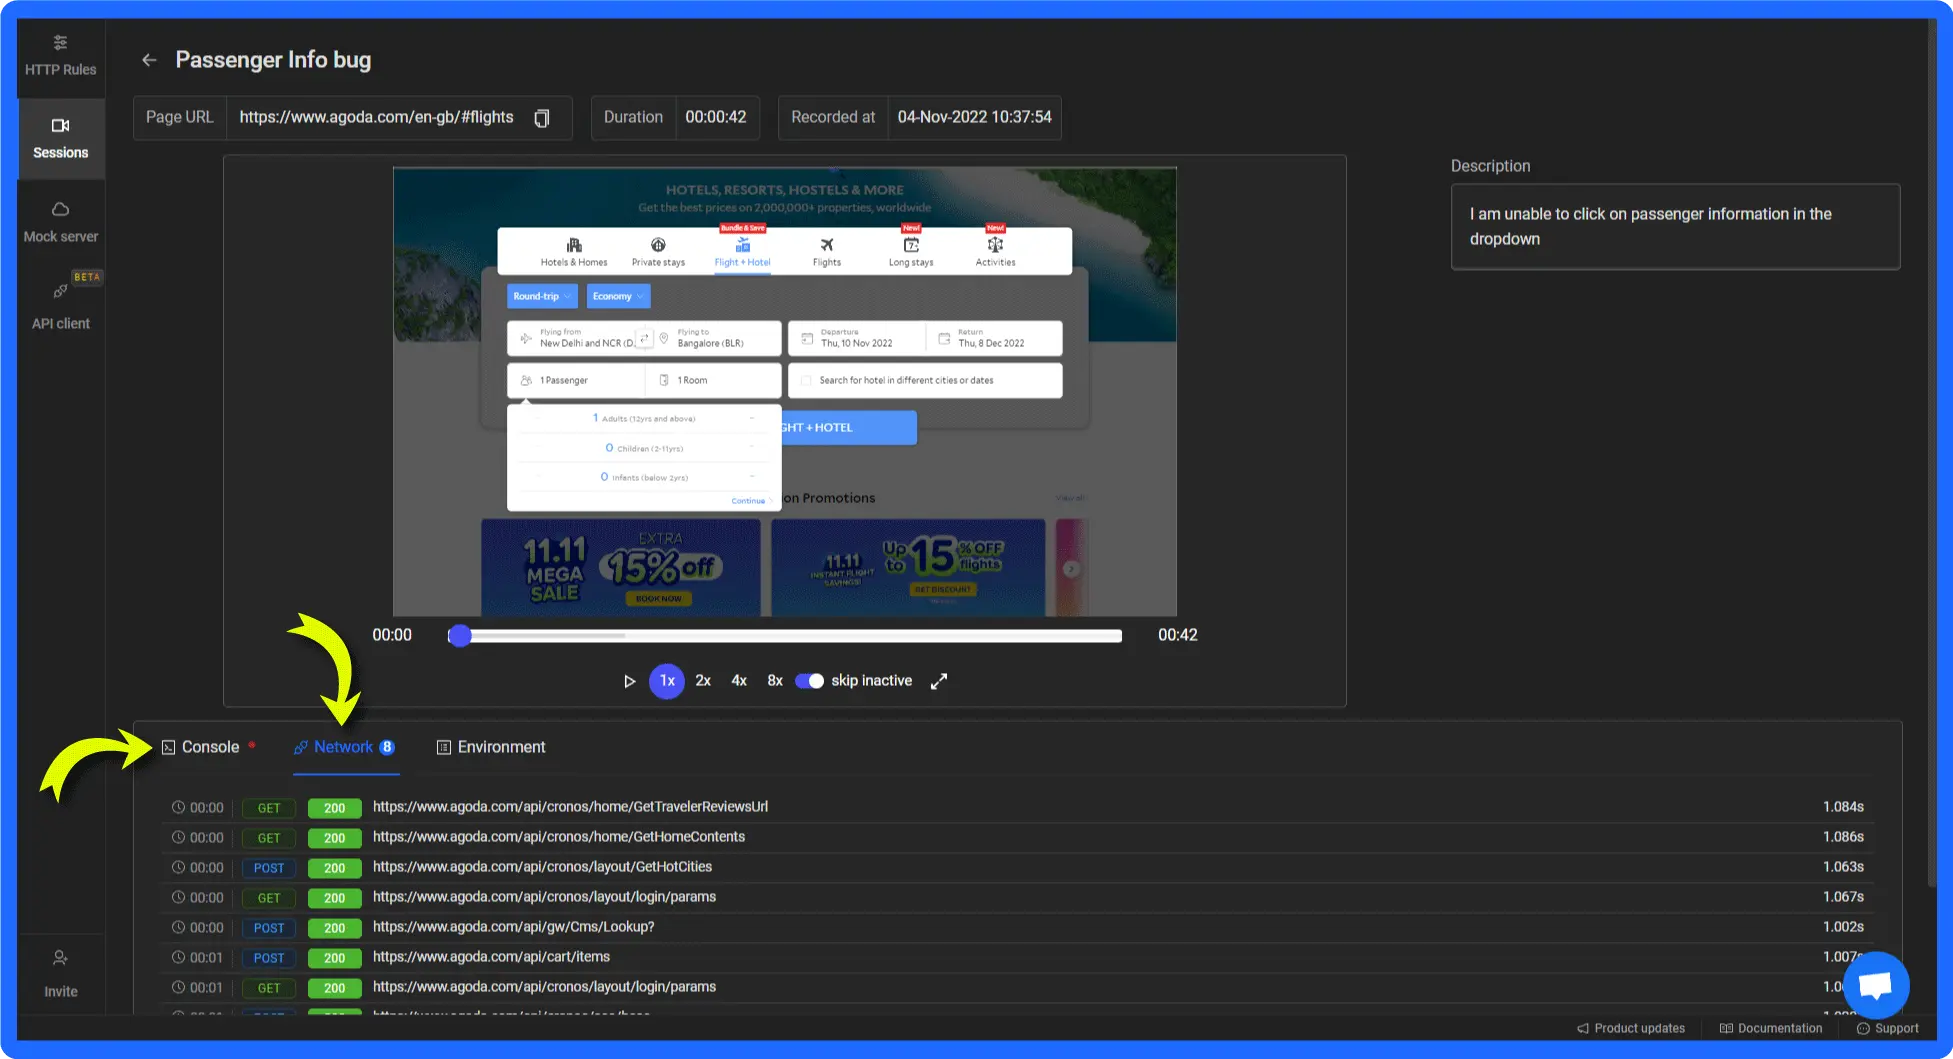
Once you share a session, developers can play back the session in their browser. Experience the issue as how the reporter faced it. As the video is played, network logs and console logs appear in respective tabs in a time-travel manner.
Here’s a screenshot of the network logs shown on Agoda’s session.
Testing & Debugging APIs
In order to make it easier for developers to play around with HTTP traffic (or APIs), Requestly offers the following features
- API Client – Test API endpoints
- Mock Server – Create Mock Responses
- HTTP Rules – Modify HTTP Headers, API Request/Response Body, and Redirects.
Developers can inspect the traffic from a shared session, and resend an API to compare the latest response with the shared response. Moreover, Modify API Response can be used to return the response from the session for a particular API endpoint.
Conclusion
Session Replays by Requestly can streamline the bug-reporting process within the company saving time for everyone. Issue reporters can quickly send the bug reports with complete context and developers can troubleshoot the issues faster.
Enjoyed this article, Try out the Requestly Session Replays and make your debugging experience faster.
Happy Debugging!
Contents
Subscribe for latest updates
Share this article
Related posts

