What is a HAR file and How to analyze them?
HAR(HTTP Archive) files contain a lot of information, including the URL of each request, request and response headers, timings, and any error messages or status codes encountered during the communication. This data is useful for analyzing web performance, diagnosing issues, and debugging network-related problems. Requestly provides you the capability to analyze and replay requests from the HAR file.
What you can do with a HAR file?
HAR analysis proves valuable in a wide range of scenarios, some of the most common ones are as listed:
Debugging API integrations: Frontend developers often interact with backend APIs to fetch data or send requests. HAR analysis allows them to inspect the headers, payloads, and responses exchanged between the frontend and backend, enabling them to identify and resolve any issues or errors in the API integration.
Debugging page redirects: Developers often struggle while mapping redirects especially in cases like setting up authentication flows. For such cases, you can locate redirect requests with 3xx status codes, and analyze their details. Further, following the redirect chain by examining the “Location” header in each redirect response helps. Target URLs can also be validated to ensure they lead to the expected destinations.
Debugging page rendering issues: There might be cases where a page fails to render correctly. In such cases, quick analysis of status codes could help identify the request that could have caused the issue.The easiest way to start determining what’s failing is to take a working, and a non-working capture, and comparing the two to see what’s failing to load properly.
Performance monitoring: HAR analysis enables efficient identification of performance bottlenecks and optimisation opportunities. Devs can check through request details like request timings, load times, and resource sizes to identify the requests/resources creating issues and work to improve them.
How to analyze a HAR file?
Requestly is an open-source and cross-platform developer tool which proves to be incredibly useful for various scenarios described above. You can use Requestly to fast track your debugging process by not only identifying issues fast but also testing possible solutions quickly.
Importing HAR file
Follow the below mentioned steps:
- Download Requestly’s Desktop App from here.
- Navigate to the sessions tab from the sidebar and click on “Import HAR” button.
- You will then be prompted to upload the HAR file you have. If you don’t have a HAR, you can generate a HAR file as described here.
- You can now view and analyze sessions in Requestly.

HAR analysis using Requestly
Using Requestly, you can streamline your debugging process, swiftly pinpoint issues, and test potential solutions with ease, making your workflow more efficient and productive. Feature details are as follows:
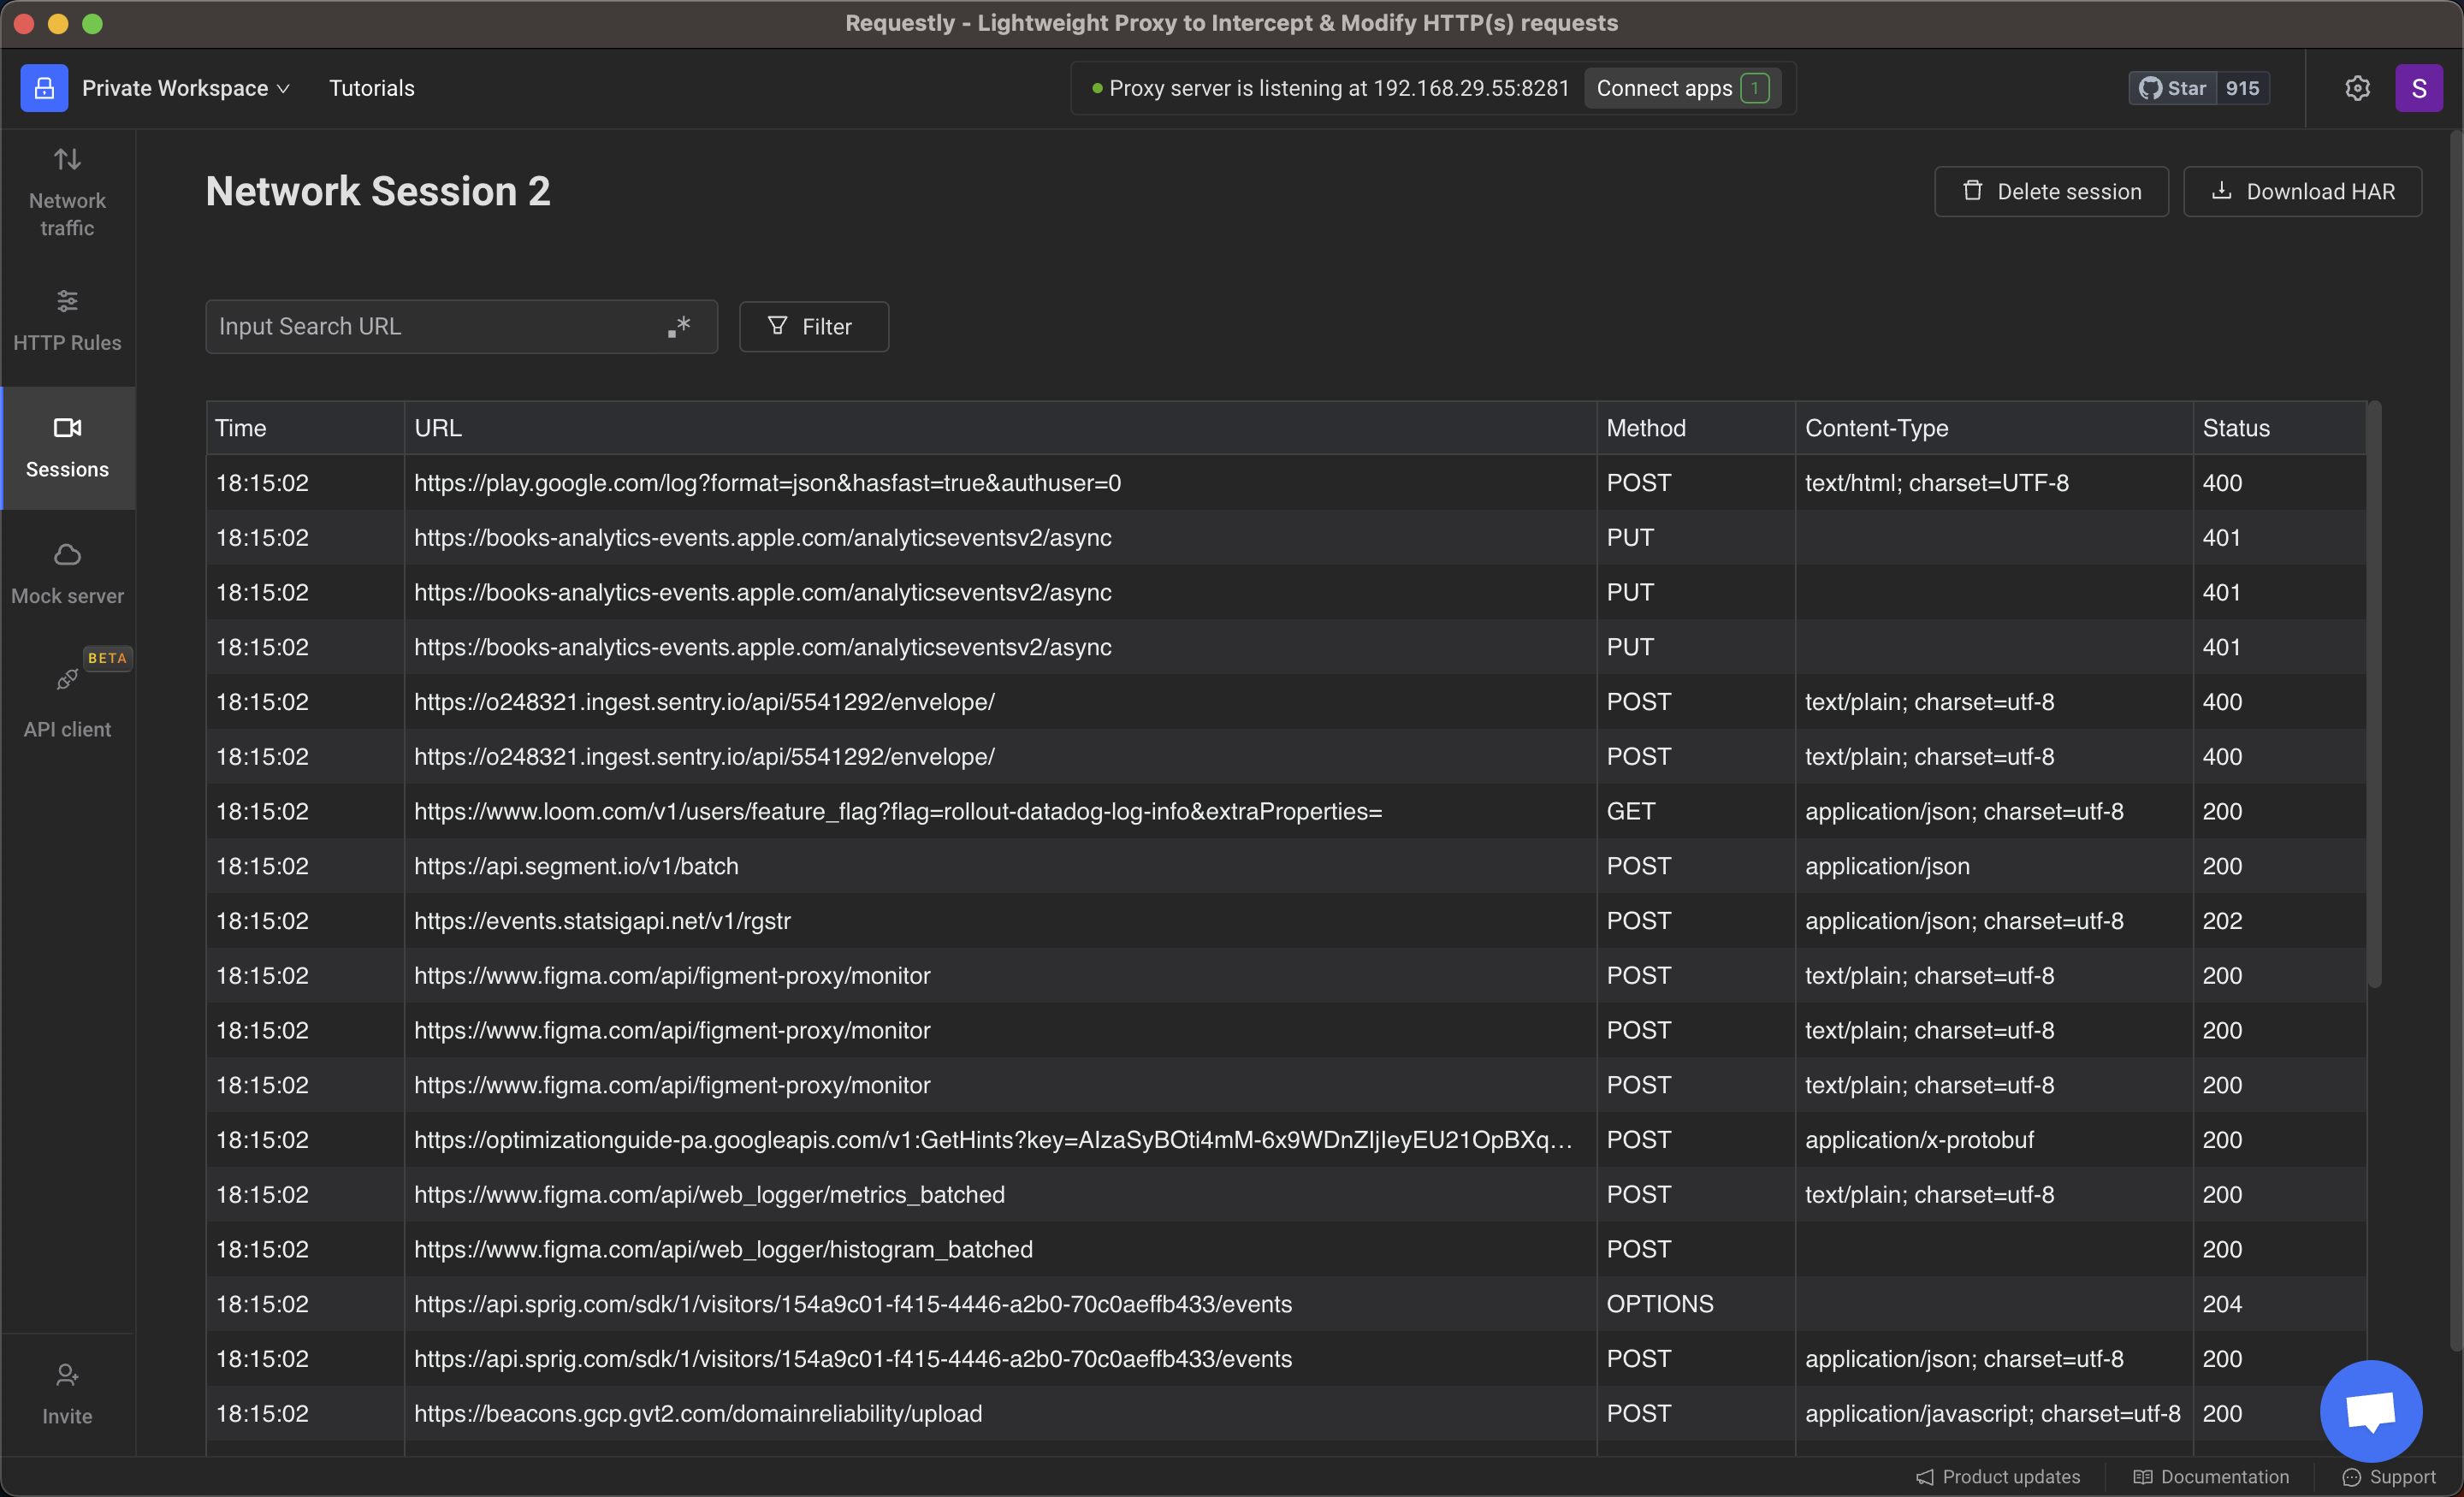
Traffic inspection: Requestly offers a user-friendly interface that allows you to import and visualize the contents of a HAR file in a structured and comprehensive manner. With interactive features like search, filtering, and grouping traffic, you can precisely look for the requests you want to work with.
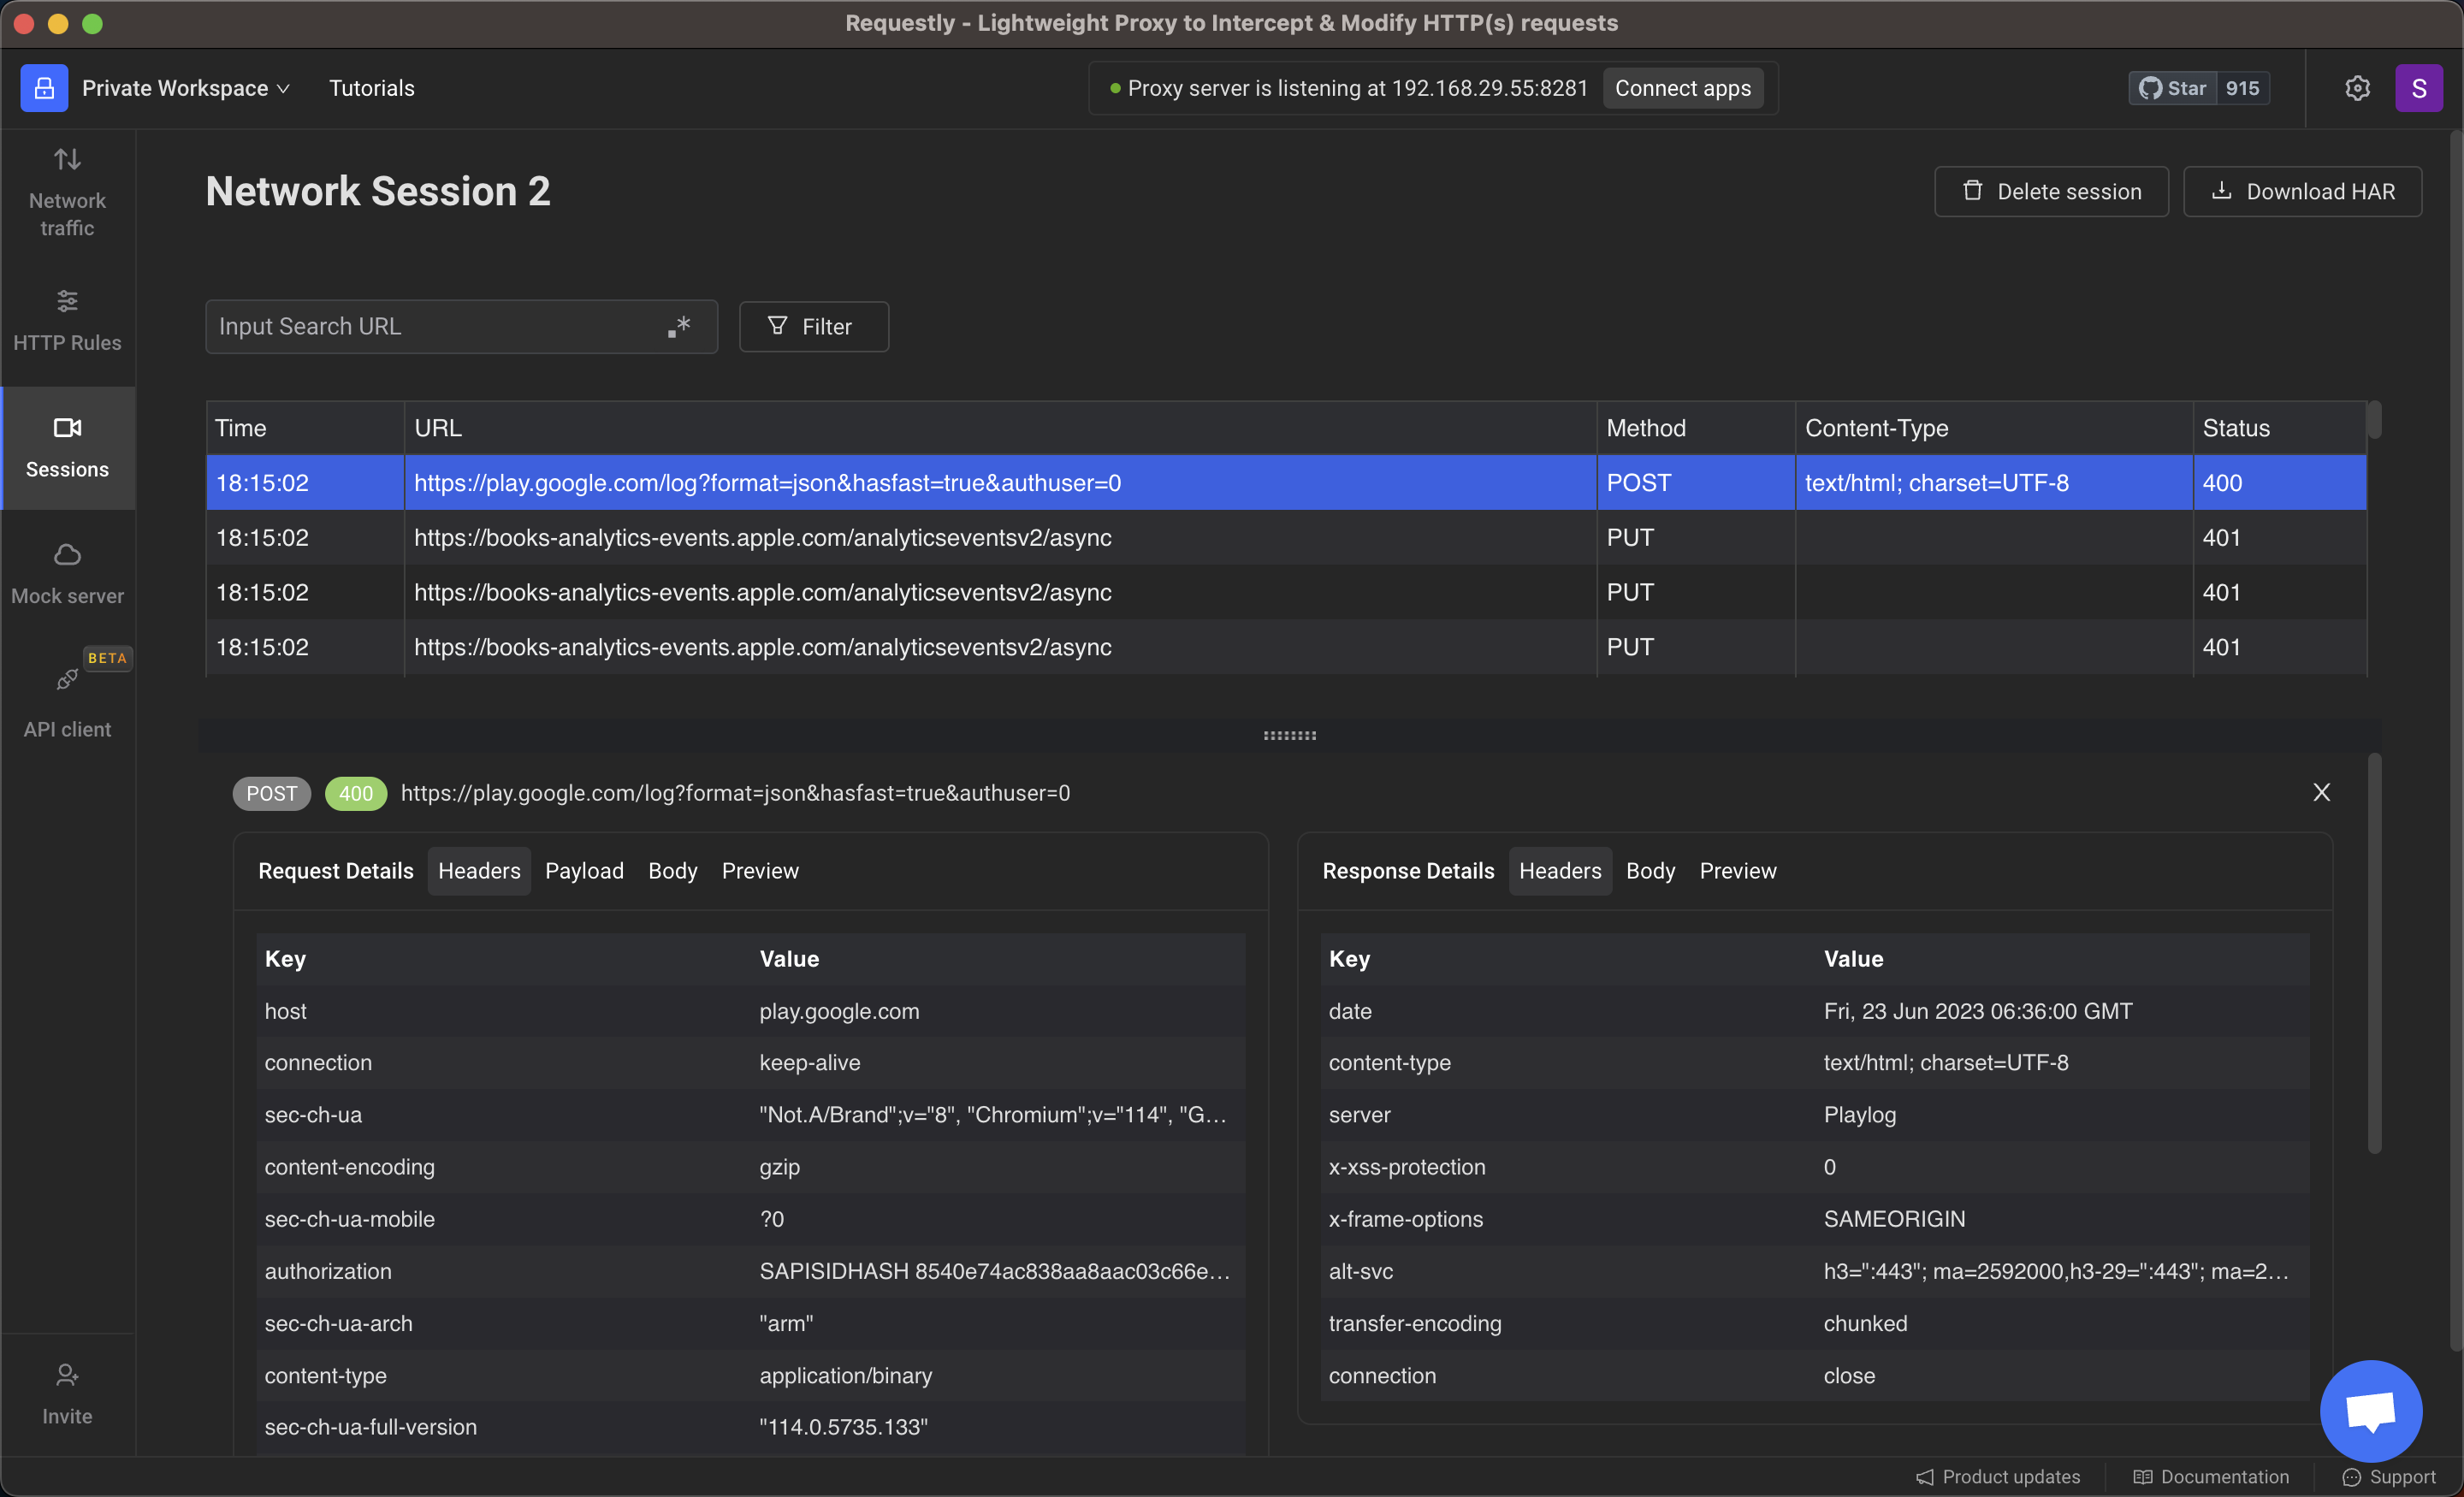
Request and response analysis: You can further explore individual HTTP requests and responses. You can view details such as request URLs, headers, cookies, response headers, status codes, and response bodies.
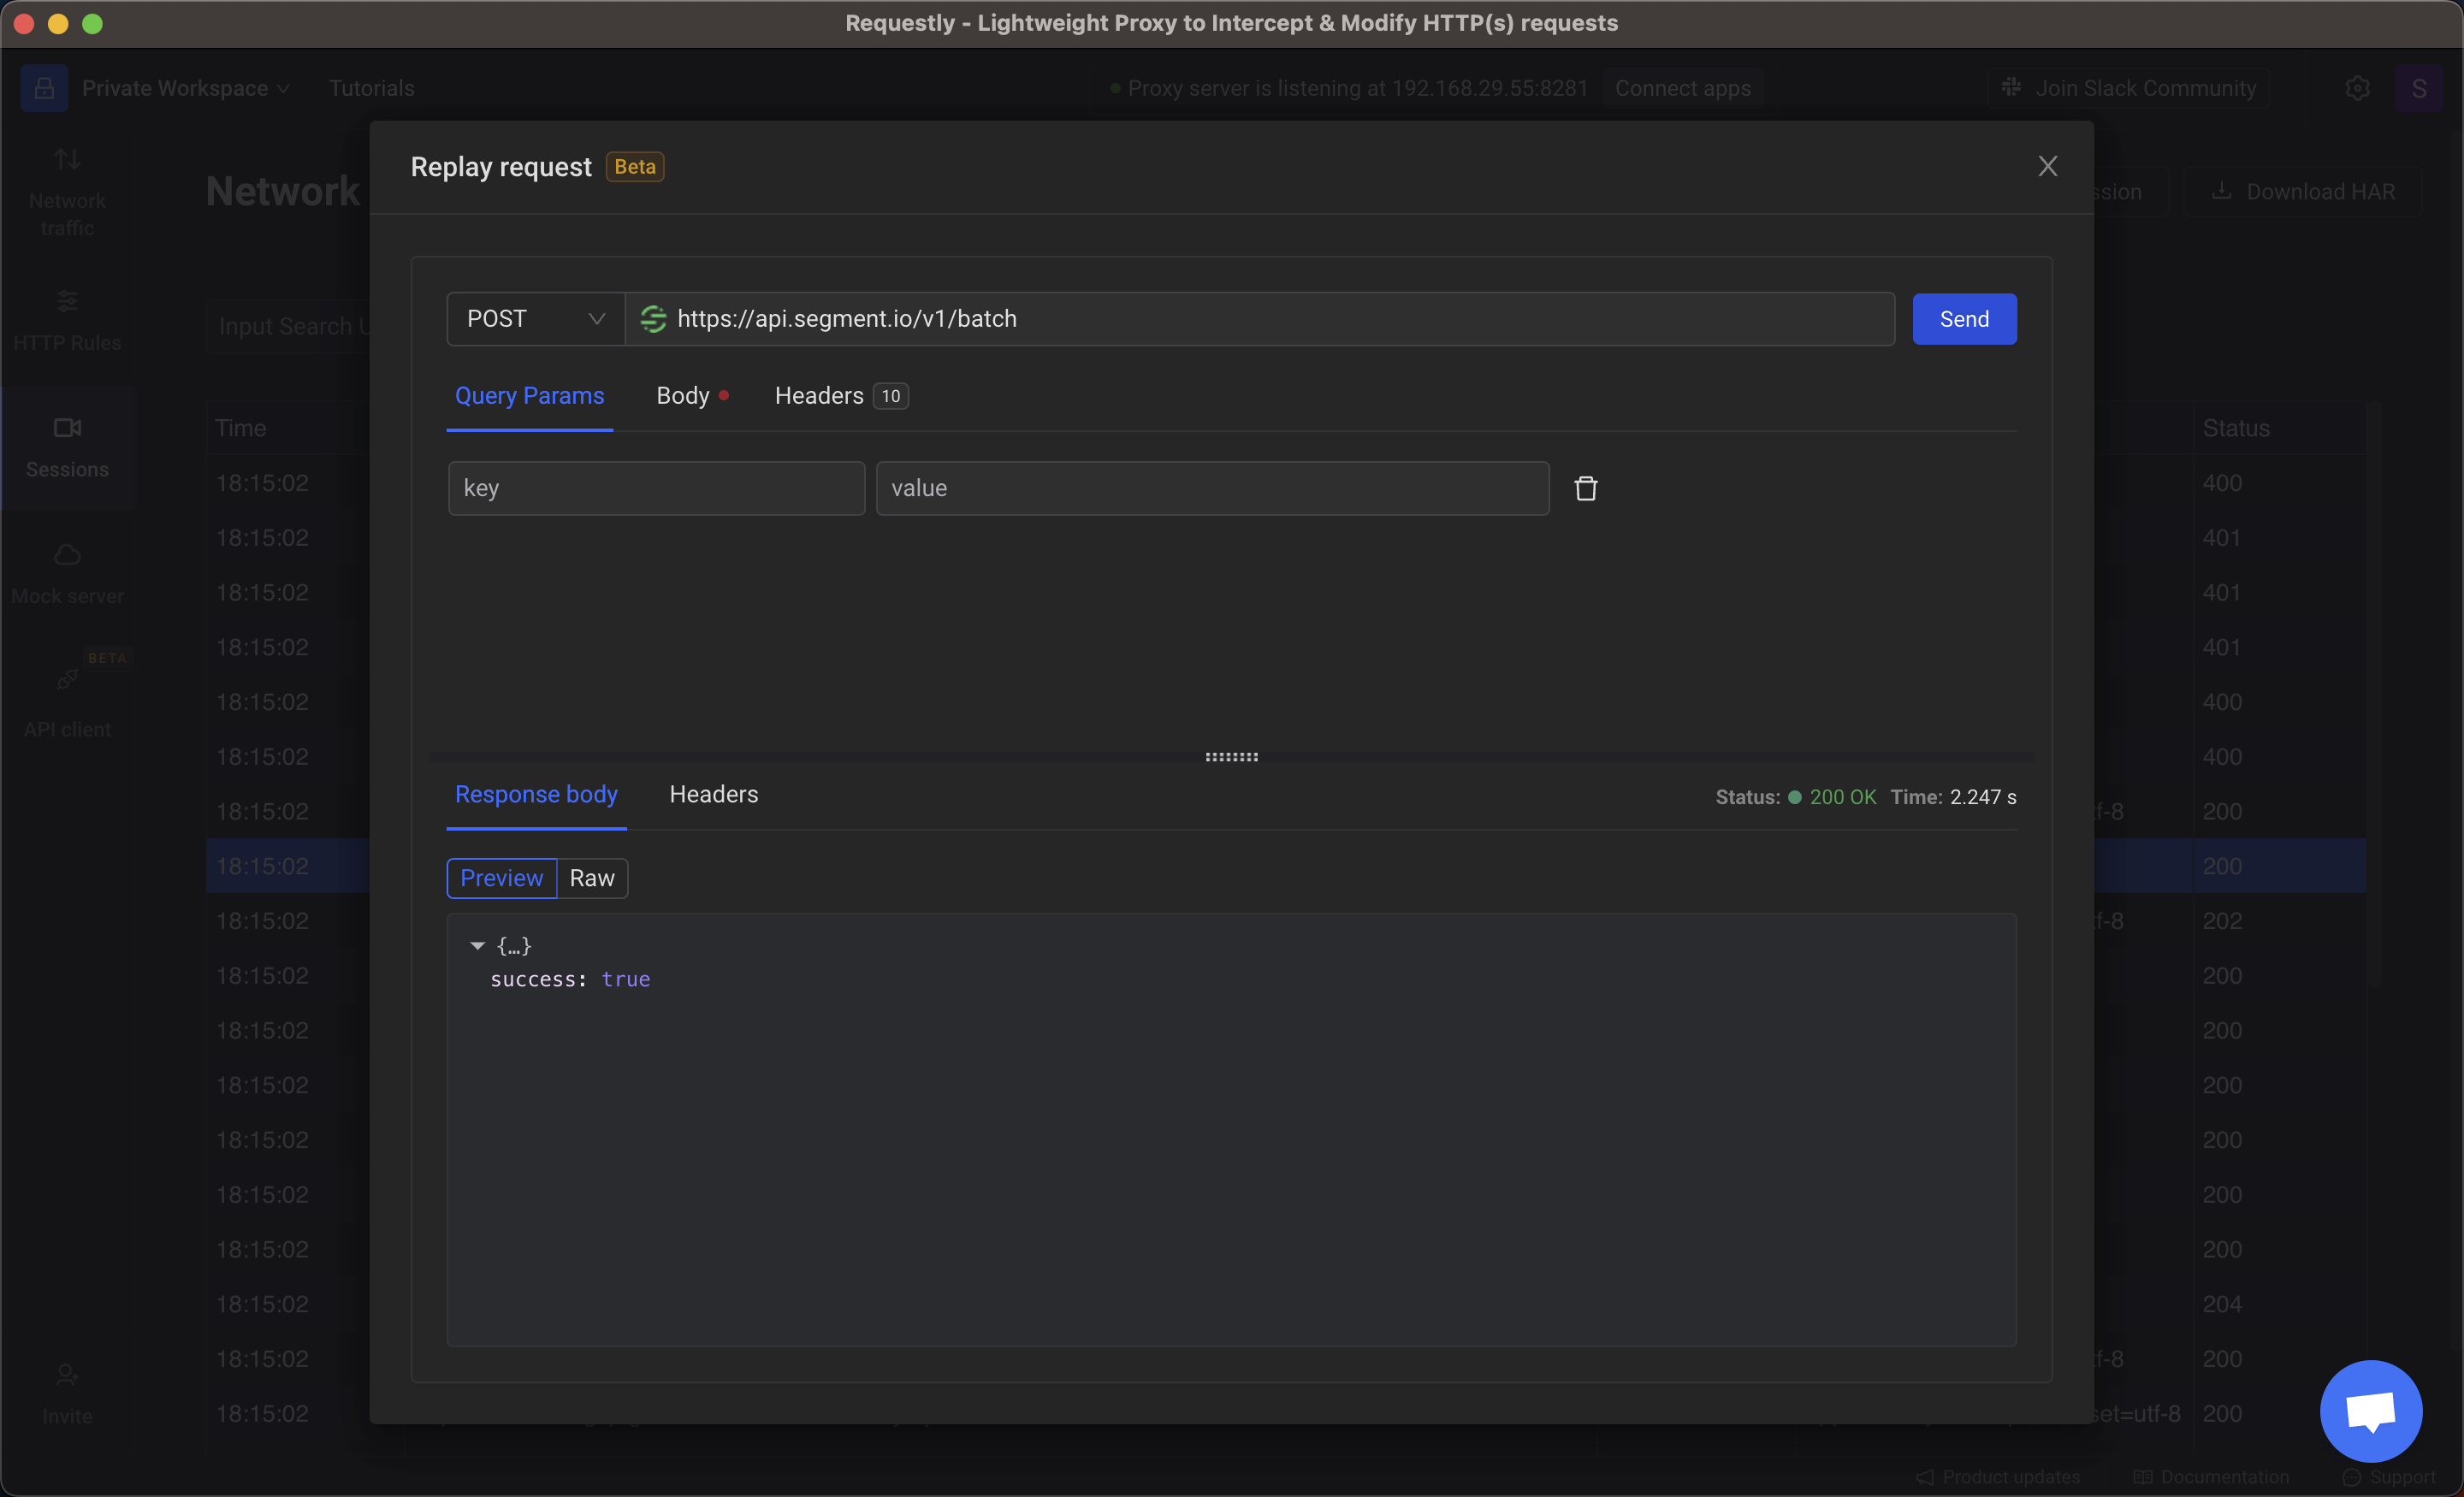
Edit and replay Responses: Using Requestly, you edit requests and replay them on-the-go directly from the traffic viewer. You can use custom parameters and test the responses. This seamless integration enhances your workflow and saves you valuable time in debugging issues.
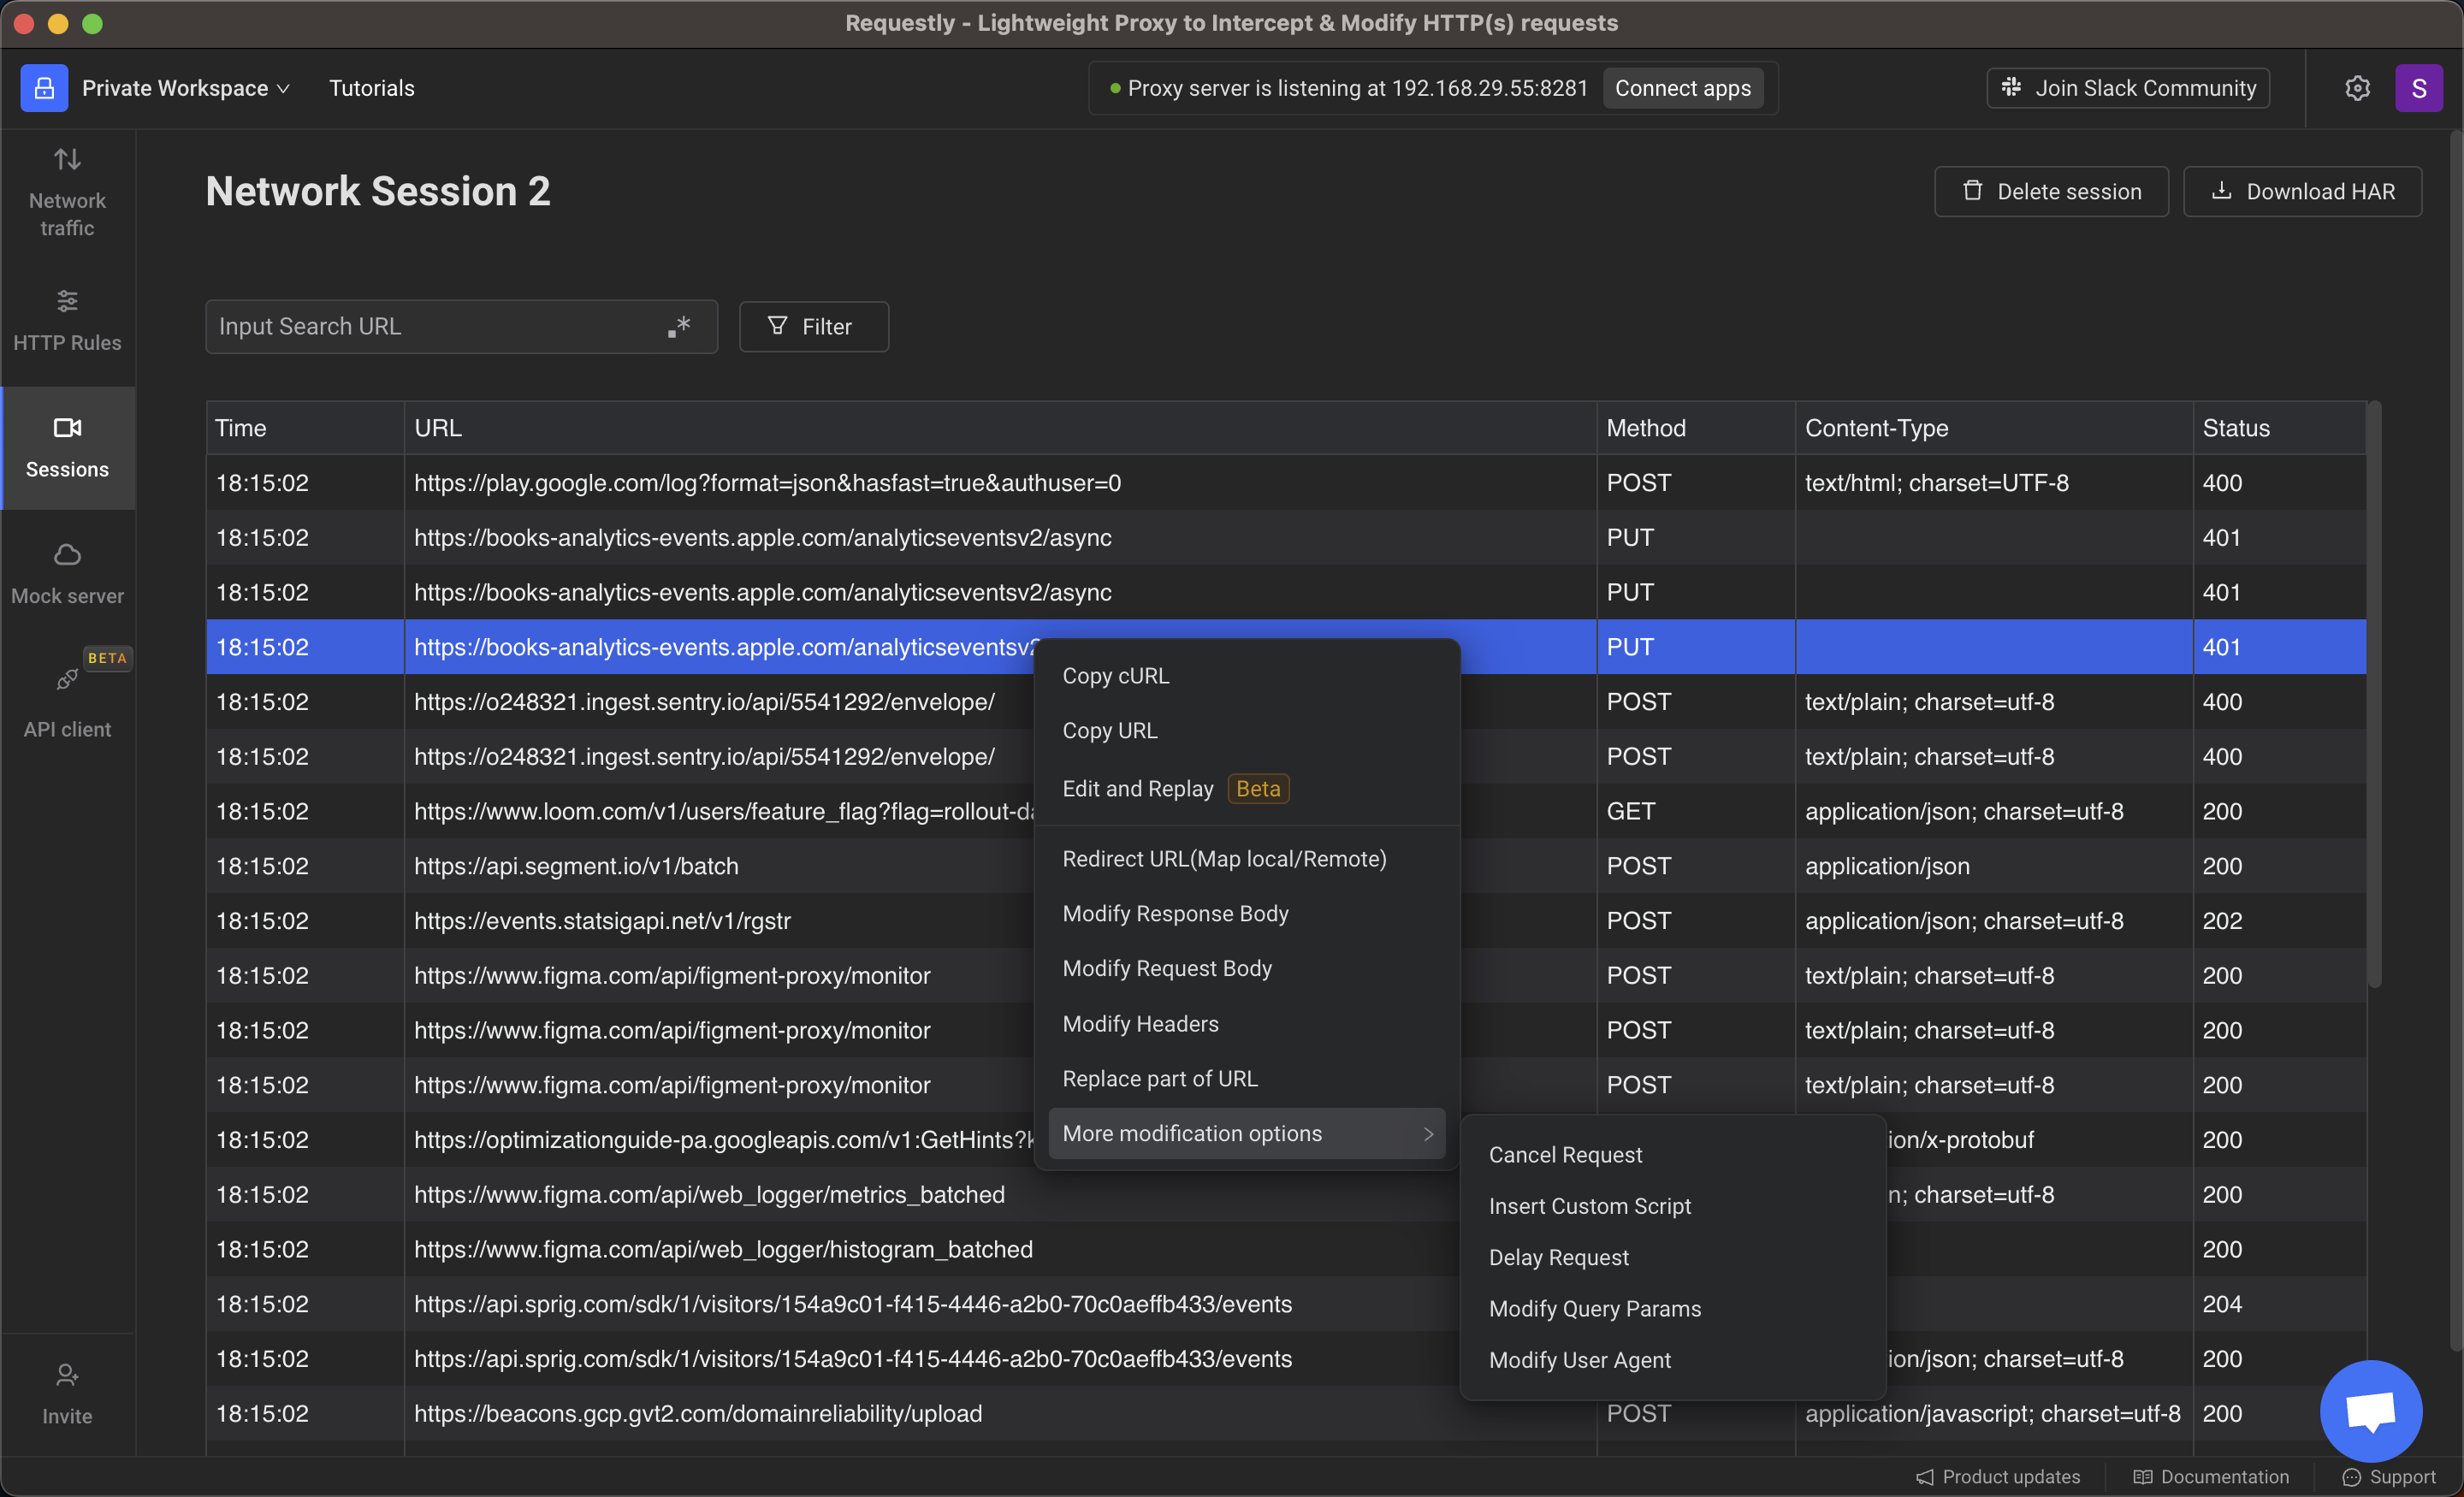
Advanced rule modifications available: Requestly offers a variety of different rule types. You can use rules to test code changes directly on production without doing any deployment. You can simply redirect resources from local to production, mock the API responses, modify headers and check for what’s solving your problem.
Conclusion
Requestly is truly a one-stop solution for all your debugging needs. It allows you to connect and intercept network requests from various sources, including Android devices, iOS devices, or browsers. Furthermore, it enables you to analyze the network requests, utilizing an extensive range of features, to diagnose and debug any issues. Give it a try and experience the power of Requestly!
Contents
Subscribe for latest updates
Share this article
Related posts


